Inspector
The Canvas Inspector is a debugging toolbar that surfaces performance metrics, database queries, and request details directly in your browser. When enabled, it automatically injects itself into HTML responses after your controller executes.
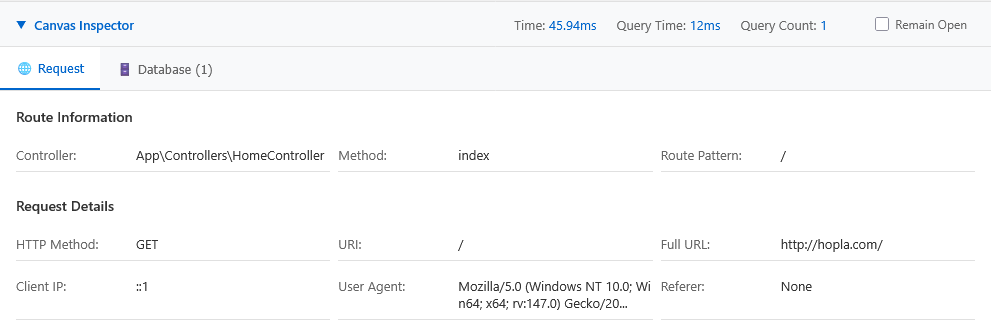
This is what the inspector looks like
Enabling the Inspector
The Inspector is configured in config/inspector.php. Keep it disabled there and enable it locally via config/inspector.local.php, which Canvas loads automatically when present and takes precedence over the base config. Exclude the local file from version control:
<?php
// config/inspector.local.php
return [
    'enabled' => true
];
How the Inspector Works
Request Lifecycle Integration
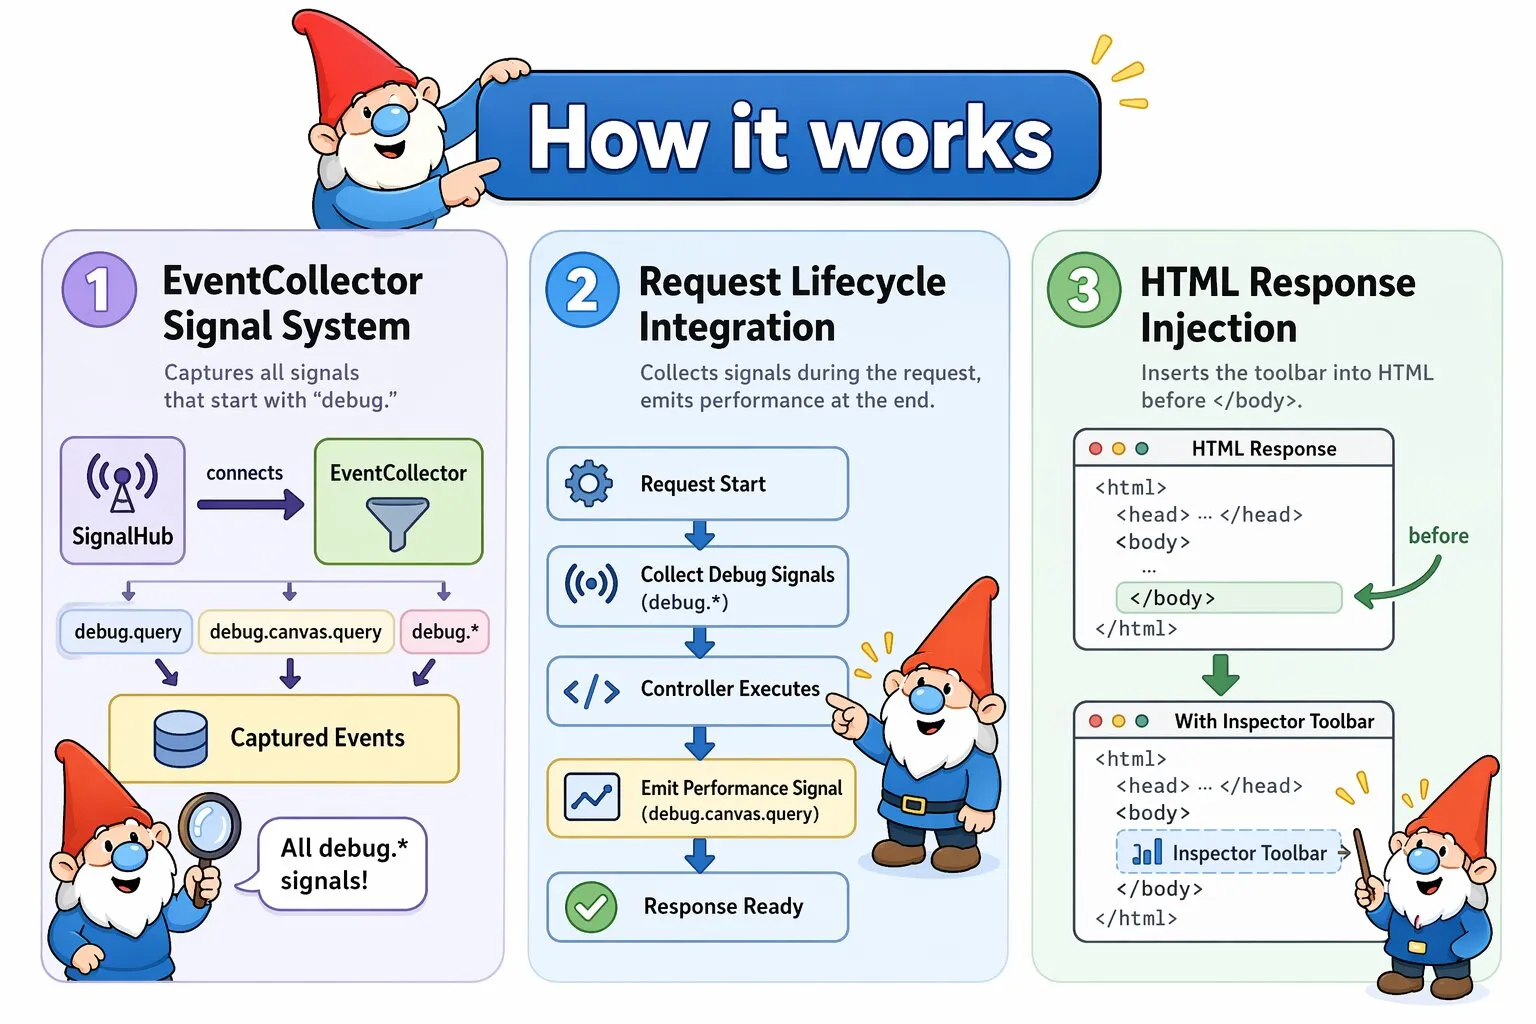
The Inspector hooks into six stages of Canvas's request handling:
- Initialization:
Kernel::handle()creates anEventCollectorif the Inspector is enabled - Event collection: As the request is processed, components emit debug signals (e.g.,
debug.database.query). The EventCollector captures every signal whose name starts withdebug. - Controller execution: Your application processes normally — routing, controller methods, database queries, and so on
- Performance signal: After the controller returns, Kernel emits a
debug.canvas.querysignal containing route info, execution time, and memory usage - Injection:
Inspector::inject()inserts the debug toolbar into the response HTML before the closing</body>tag - Response: The browser receives the response with the toolbar included
HTML Detection and Injection
The Inspector only modifies responses with a text/html content type. JSON, XML, and other response types pass through unmodified, so API endpoints incur no overhead. If the HTML lacks a </body> tag, the Inspector falls back to injecting before </html>. If neither tag is found, it wraps the content in a complete HTML document.
debug. — any component that emits such a signal will appear in the Inspector without any further configuration. For a full explanation of signals and how to use them, see the SignalHub documentation.
Toolbar States
The injected toolbar appears at the bottom of the browser window in two states:
- Collapsed: Shows summary statistics at a glance — execution time, query count, total query time, and memory usage — along with tab icons for each panel.
- Expanded: Click the toolbar to expand it into a full panel view with tab navigation. The expanded state persists across page loads via localStorage.
Request Panel
The Request Panel is always present when the Inspector is enabled. It displays data from the debug.canvas.query signal:
- Route information: Controller class, method, route pattern (e.g.,
/users/{id}), and resolved parameters - Request details: HTTP method, full URI, client IP, and user agent
- POST data: Form fields submitted via POST, PUT, or PATCH
- File uploads: File names, sizes, MIME types, and temporary paths
- Cookies: All cookies sent with the request
- Legacy indicator: Whether the request was handled by a legacy PHP file or a Canvas controller
Optional Panels
Some Canvas ecosystem components ship with their own Inspector panel. These panels are not registered by default — add them to your configuration only when the corresponding component is part of your stack.
ObjectQuel Query Panel
ObjectQuel is our domain-level query engine with integrated ORM capabilities. Rather than working directly with SQL tables and rows, you write queries in terms of your domain model — ObjectQuel translates them into the appropriate database operations and maps the results back to objects. Register the panel in config/inspector.php:
<?php
// config/inspector.php
return [
    'enabled' => true,
    'panels' => [
        \Quellabs\Canvas\Inspector\Panels\QueryPanel::class
    ]
];
Enabling query plan output
The panel is always registered when you add it to your Inspector config, but it only collects data when development_mode is enabled in config/database.php. Without it, the panel appears but shows no queries — ObjectQuel does not run the planning pass and emits no debug signal.
<?php
// config/database.php
return [
    'development_mode' => true,
    // ...
];
This flag is independent of Canvas's debug mode — you can enable it on a production server temporarily to diagnose a query without touching anything else. Use config/database.local.php to enable it locally without committing the change:
<?php
// config/database.local.php
return [
    'development_mode' => true,
];
The panel shows:
- Query and SQL: The ObjectQuel statement on the left, the generated SQL on the right. Queries that decompose into multiple stages (e.g. those requiring temp table materialization) show numbered stage buttons — click each to switch between the SQL for that stage.
- Query plan (development mode only): A table of every decision the optimizer and planner made, in pipeline order. Each row shows the source (
optimizerorplanner), category, decision code, a plain-English reason, and the range or field the decision applies to. - Bound parameters: The values bound to prepared statement placeholders for that query.
WakaPAC Spy Panel
WakaPAC is our reactivity library built around the Presentation-Abstraction-Control (PAC) architectural pattern and a Win32-style messaging system. UI components communicate by passing typed messages rather than calling each other directly, keeping presentation logic cleanly separated from application state. Register the panel in config/inspector.php:
<?php
// config/inspector.php
return [
    'enabled' => true,
    'panels' => [
        \Quellabs\Canvas\Inspector\Panels\WakaPACPanel::class
    ]
];
The panel shows:
- Live tab: A rolling ring buffer of the most recent messages, updated in real time
- Recording tab: Start and stop recording into an unbounded list. The recorded sequence is preserved in its own tab while the live buffer continues rolling
- Message collapsing: High-frequency messages (
MSG_MOUSEMOVE,MSG_TIMER,MSG_MOUSEWHEEL) collapse into a single row with a repeat counter instead of flooding the table - Category filters: Toggle visibility per category — Mouse, Move, Wheel, Key, Focus, Timer, Drag, Input, Size. Filters apply at intake, so the buffer only contains messages you want to see
- Details column: Decodes wParam/lParam per message type into human-readable form (coordinates, modifier keys, virtual key names, wheel delta, element dimensions)
- Target column: Shows the DOM element that originated the event (e.g.,
button#submit,span.icon) when it differs from the container
Performance Considerations
When Enabled
- The EventCollector stores all
debug.*events in memory for the duration of the request - Panels process events and generate HTML after the controller returns
- The response body is scanned for the
</body>tag to determine the injection point - Typical overhead: 5–20 ms and 1–5 MB of memory, depending on event count
When Disabled
Zero overhead. The EventCollector is never instantiated, no events are stored, and the response is not parsed. Signal emissions still occur but have no connected receivers, so the cost is negligible.
ObjectQuel development mode
When development_mode is enabled in config/database.php, ObjectQuel runs a planning pass per query and emits a debug signal containing the full query plan and generated SQL. Without it, the QueryPanel receives no data and displays nothing. The flag is independent of Canvas debug mode and the Inspector — you can enable it on a live server to diagnose a specific query without affecting anything else. Disable it again when you are done, as it adds a measurable overhead per query.
Best Practices
- Never emit sensitive data: Passwords, API keys, and session tokens must not appear in debug signals
- Use local config overrides: Enable the Inspector and ObjectQuel development mode via
*.local.phpconfig files and exclude them from version control, rather than toggling flags in the committed config - Mind the overhead of development mode: The ObjectQuel planning pass adds a measurable cost per query. It is safe to enable temporarily in production to diagnose a specific issue, but disable it again once you are done
- Test panel performance: Ensure your panels don't introduce expensive operations that slow down debugging itself